> ## Documentation Index
> Fetch the complete documentation index at: https://polar-handbook-psincraian-elastic-greider-765c1a.mintlify.site/llms.txt
> Use this file to discover all available pages before exploring further.
# Investigating Worker Memory Leak in Polar
> A deep dive into debugging memory leaks in our Python worker system using Dramatiq and Redis
**Author:** Petru Rares Sincraian • **Published:** August 29, 2025
I'm trying to find the memory leak in the polar source code for Worker. The main stack is Python 3.12, Dramatiq with Redis as a Broker.
From what I see, I see in Logfire some message types are repeating themselves. As I would expect:
```sql theme={null}
SELECT
time_bucket('10 min', start_timestamp) AS time,
attributes->>'actor' as actor,
COUNT() as count
FROM records
WHERE attributes->>'actor' IS NOT NULL AND parent_span_id IS NULL
GROUP BY actor, time
order by time, count desc
```
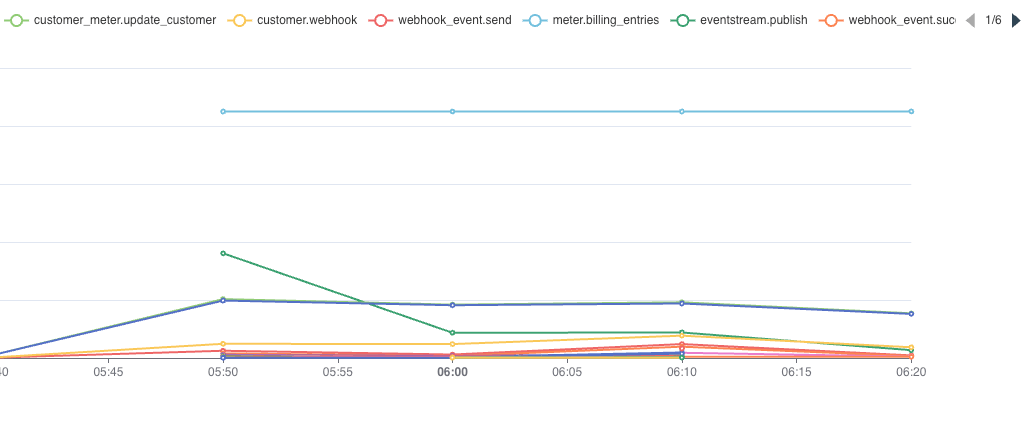 The top messages that repeats every time are:
1. `meter.billing_entries`
2. `eventstream.publish`
3. `customer_meter.update_customer`
4. `event.ingested`
5. `customer.webhook`
6. `webhook_event.send`
7. `webhook_event.succees`
8. `email.send`
9. `stripe.webhook.invoice.paid`
10. `benefit.enqueue_benefits_grants`
11. `notifications.send`
12. `stripe.webhook.customer.subscription.updated`
13. `order.discord_notification`
14. `payout.trigger_stripe_payout`
15. `stripe.webhook.invoice.created`
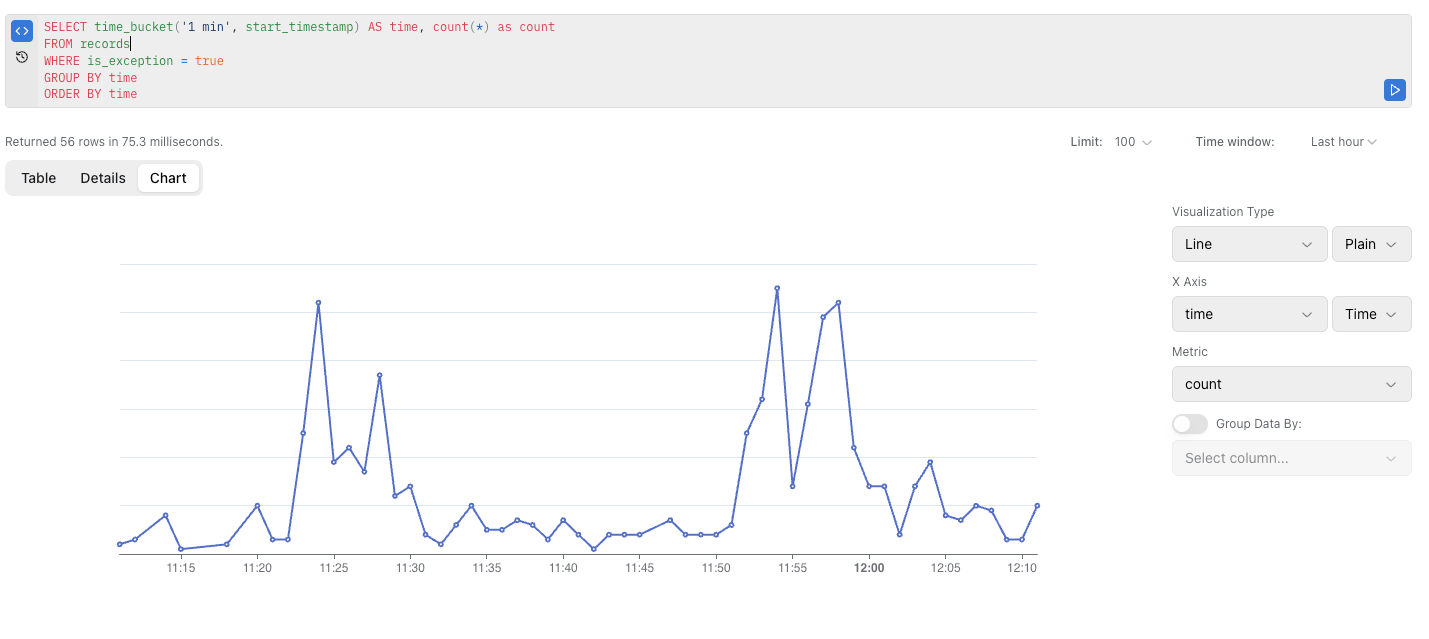
Also, we have exceptions on every single minute. So this can also be the source of the problem.
```sql theme={null}
SELECT time_bucket('1 min', start_timestamp) AS time, count(*) as count
FROM records
WHERE is_exception = true
GROUP BY time
ORDER BY time
```
The top messages that repeats every time are:
1. `meter.billing_entries`
2. `eventstream.publish`
3. `customer_meter.update_customer`
4. `event.ingested`
5. `customer.webhook`
6. `webhook_event.send`
7. `webhook_event.succees`
8. `email.send`
9. `stripe.webhook.invoice.paid`
10. `benefit.enqueue_benefits_grants`
11. `notifications.send`
12. `stripe.webhook.customer.subscription.updated`
13. `order.discord_notification`
14. `payout.trigger_stripe_payout`
15. `stripe.webhook.invoice.created`
Also, we have exceptions on every single minute. So this can also be the source of the problem.
```sql theme={null}
SELECT time_bucket('1 min', start_timestamp) AS time, count(*) as count
FROM records
WHERE is_exception = true
GROUP BY time
ORDER BY time
```
 # Hypothesis 1: The leak is caused by a specific message type
My plan is to try to replicate the error locally. I would suspect that it's one of the message types that are happening.
I created a script that can perfom some operations for me, like ingesting events, creating customers, or listening to webhooks.
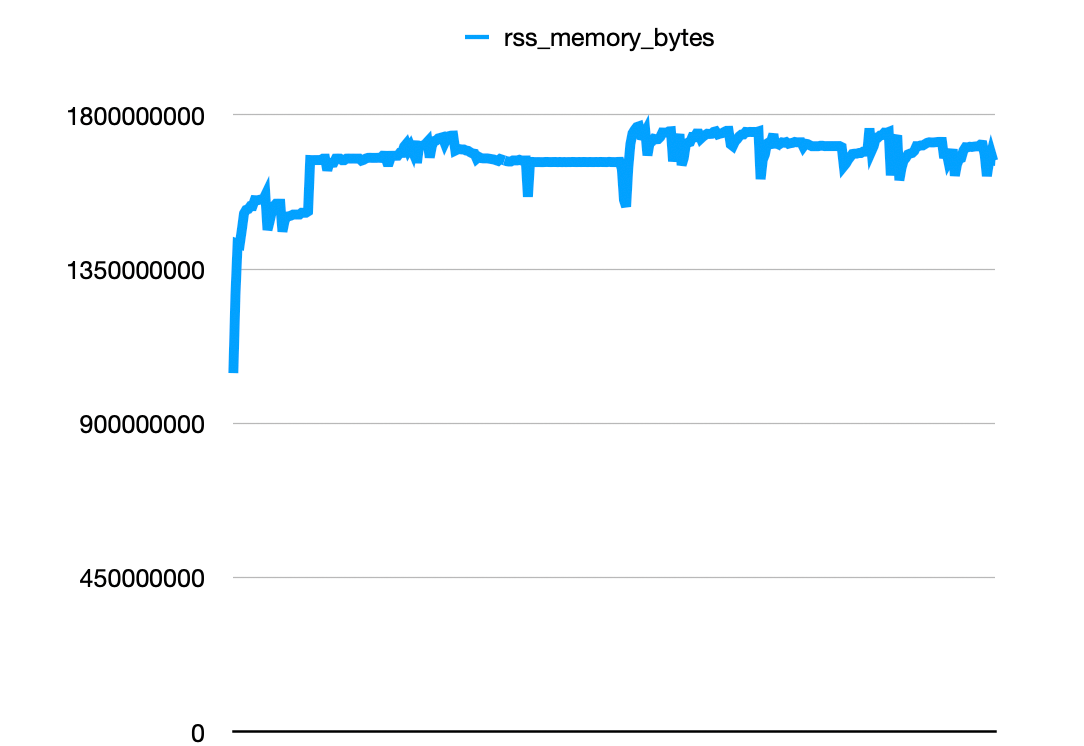
I tried sending different messages, at least 100 of the following, and I don't see any pattern in the memory leaks. All charts look like this:
# Hypothesis 1: The leak is caused by a specific message type
My plan is to try to replicate the error locally. I would suspect that it's one of the message types that are happening.
I created a script that can perfom some operations for me, like ingesting events, creating customers, or listening to webhooks.
I tried sending different messages, at least 100 of the following, and I don't see any pattern in the memory leaks. All charts look like this:
 I tried with the following message types:
* Ingest an event
* Create a customer
* Sending webhooks
* Checkout with benefits for new customers (only 20, as it was done manually).
Failed! I tried different messages and I don't see the memory going up. I will focus on another hypothesis.
# Hypothesis 2: The leak is caused by errors
The second hypothesis is that this can be caused by some wrong resources not being closed or some misconfiguration in one of our libraries, like Logfire, Sentry, or logging.
I created a MemoryProfilerMiddleware for Dramatiq that logs the increase in memory, the total memory, and the top allocations that consume memory. I created a small script to ingest events for the same customer, but throwing an error. The results seem promising.
I tried with the following message types:
* Ingest an event
* Create a customer
* Sending webhooks
* Checkout with benefits for new customers (only 20, as it was done manually).
Failed! I tried different messages and I don't see the memory going up. I will focus on another hypothesis.
# Hypothesis 2: The leak is caused by errors
The second hypothesis is that this can be caused by some wrong resources not being closed or some misconfiguration in one of our libraries, like Logfire, Sentry, or logging.
I created a MemoryProfilerMiddleware for Dramatiq that logs the increase in memory, the total memory, and the top allocations that consume memory. I created a small script to ingest events for the same customer, but throwing an error. The results seem promising.
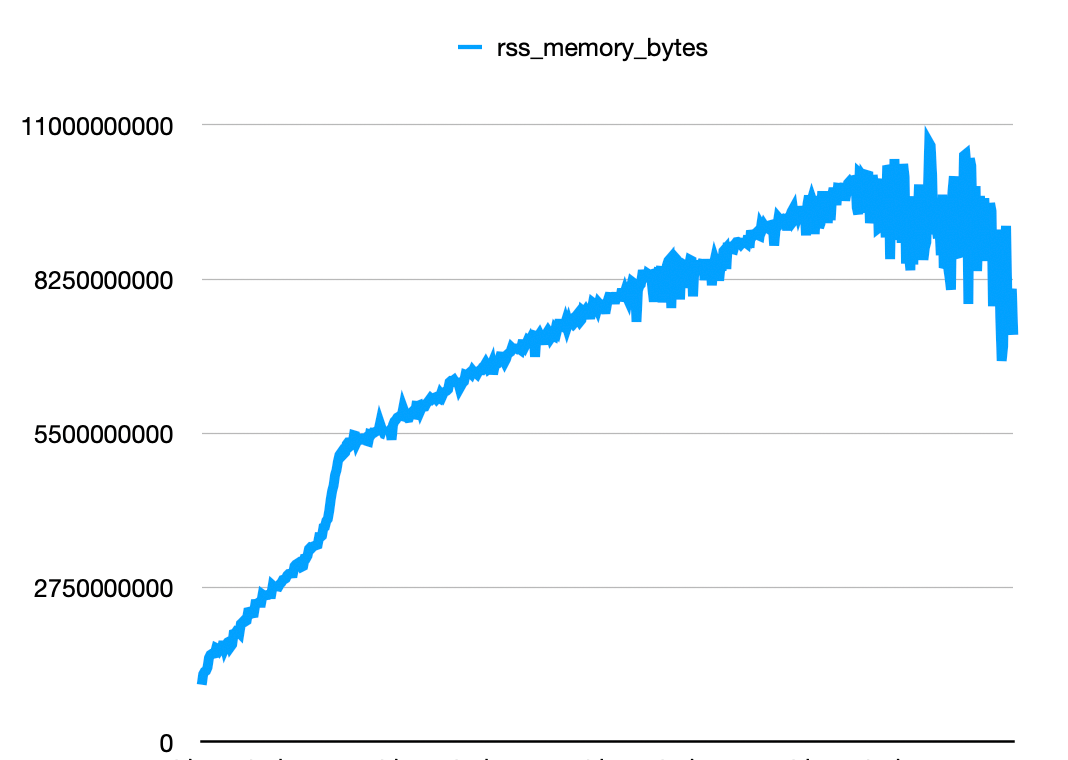 For events ingested without an error, we don't have this behavior, and a straight memory consumption is maintained. For the `webhook_event.send` if it throws an error we also see the same behavior. Then we can confirm that the memory leak it's happening when an exception is thrown. We tested 2 different message types, so the idea is that something is off on some configuration or a library that we are using.
Checking the top tracemalloc line that created the memory, we can see that in most cases the errors are in:
* `polar/server/.venv/lib/python3.12/site-packages/sentry_sdk/utils.py:439`
* `polar/server/.venv/lib/python3.12/site-packages/opentelemetry/sdk/trace/**init**.py:1020`
If we the increase in memory for every message that throws an exception we can see that most of the time the memory keeps increasing.
I uninstalled Sentry and Logfire and removed the `configure_logging()` And it appears that the memory is stable now when receiving webhooks with errors 🙌
For events ingested without an error, we don't have this behavior, and a straight memory consumption is maintained. For the `webhook_event.send` if it throws an error we also see the same behavior. Then we can confirm that the memory leak it's happening when an exception is thrown. We tested 2 different message types, so the idea is that something is off on some configuration or a library that we are using.
Checking the top tracemalloc line that created the memory, we can see that in most cases the errors are in:
* `polar/server/.venv/lib/python3.12/site-packages/sentry_sdk/utils.py:439`
* `polar/server/.venv/lib/python3.12/site-packages/opentelemetry/sdk/trace/**init**.py:1020`
If we the increase in memory for every message that throws an exception we can see that most of the time the memory keeps increasing.
I uninstalled Sentry and Logfire and removed the `configure_logging()` And it appears that the memory is stable now when receiving webhooks with errors 🙌
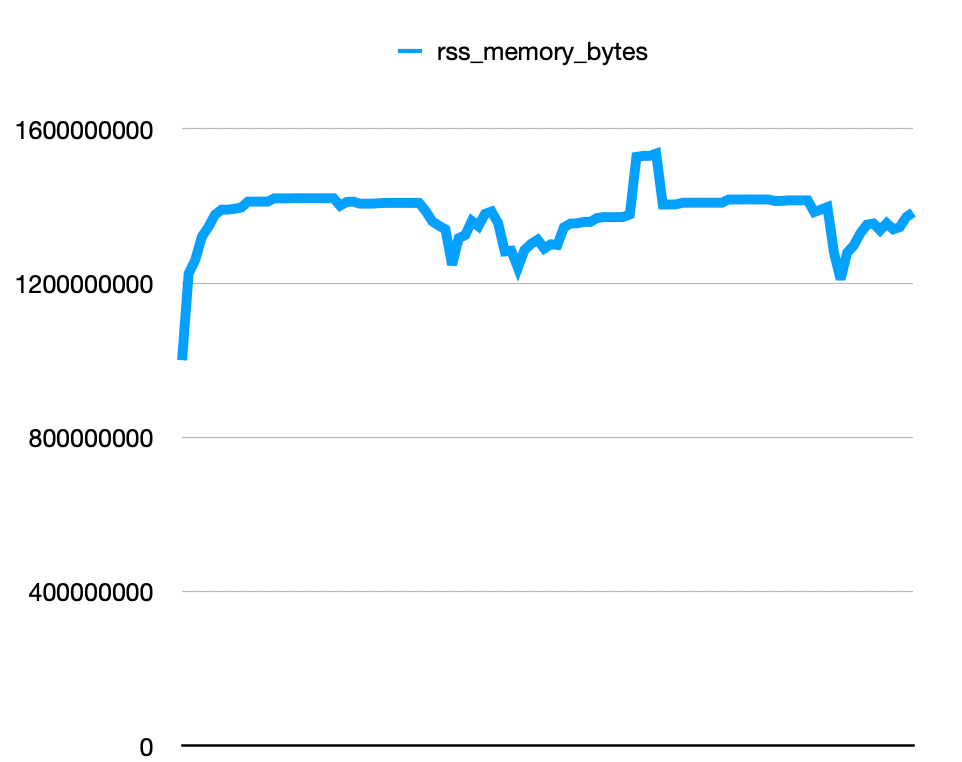 Only with Logfire uninstalled does it seem that the issue is persisting. Uninstalling only sentry seems that the issue is resolved! 🙌
Now, I changed my middleware to log the top 15 lines that hold memory with `tracemalloc`. This has generated a bunch of files in `memory_reports - webhook - with all dependencies` that it helps me analyze what the issue has been. For what I seen, these 3 lines are the ones that repeat the most
```text theme={null}
40 --------------------------------------------------------------------------------
41: #10: /Users/petru/workplace/polar/server/.venv/lib/python3.12/site-packages/sentry_sdk/scope.py:1145: size=6776 B (+768 B), count=37 (+6), average=183 B
42: File "/Users/petru/workplace/polar/server/.venv/lib/python3.12/site-packages/sentry_sdk/scope.py", line 1145
43 span = Span(**kwargs)
21: #5: /Users/petru/workplace/polar/server/.venv/lib/python3.12/site-packages/sentry_sdk/utils.py:250: size=16.6 KiB (-1297 B), count=351 (-26), average=48 B
22: File "/Users/petru/workplace/polar/server/.venv/lib/python3.12/site-packages/sentry_sdk/utils.py", line 250
23 return utctime.strftime("%Y-%m-%dT%H:%M:%S.%fZ")
41: #10: /Users/petru/workplace/polar/server/.venv/lib/python3.12/site-packages/sentry_sdk/tracing.py:439: size=7384 B (+800 B), count=60 (+6), average=123 B
42: File "/Users/petru/workplace/polar/server/.venv/lib/python3.12/site-packages/sentry_sdk/tracing.py", line 439
43 child = Span(
```
I wasn't able to locate the real issue with the Sentry Spans.
# Resources
* branch-name: `feat-memory-leak`
# Ideas
I want to try different things:
* [x] Try the workers for longer. Maybe there is some problem that I can see at the end.
* [ ] Setup webhooks
* [ ] Try different benefits, like license key or OAuth With Github.
* [x] Try throing errors to workers and see if there is any problem on retries.
Only with Logfire uninstalled does it seem that the issue is persisting. Uninstalling only sentry seems that the issue is resolved! 🙌
Now, I changed my middleware to log the top 15 lines that hold memory with `tracemalloc`. This has generated a bunch of files in `memory_reports - webhook - with all dependencies` that it helps me analyze what the issue has been. For what I seen, these 3 lines are the ones that repeat the most
```text theme={null}
40 --------------------------------------------------------------------------------
41: #10: /Users/petru/workplace/polar/server/.venv/lib/python3.12/site-packages/sentry_sdk/scope.py:1145: size=6776 B (+768 B), count=37 (+6), average=183 B
42: File "/Users/petru/workplace/polar/server/.venv/lib/python3.12/site-packages/sentry_sdk/scope.py", line 1145
43 span = Span(**kwargs)
21: #5: /Users/petru/workplace/polar/server/.venv/lib/python3.12/site-packages/sentry_sdk/utils.py:250: size=16.6 KiB (-1297 B), count=351 (-26), average=48 B
22: File "/Users/petru/workplace/polar/server/.venv/lib/python3.12/site-packages/sentry_sdk/utils.py", line 250
23 return utctime.strftime("%Y-%m-%dT%H:%M:%S.%fZ")
41: #10: /Users/petru/workplace/polar/server/.venv/lib/python3.12/site-packages/sentry_sdk/tracing.py:439: size=7384 B (+800 B), count=60 (+6), average=123 B
42: File "/Users/petru/workplace/polar/server/.venv/lib/python3.12/site-packages/sentry_sdk/tracing.py", line 439
43 child = Span(
```
I wasn't able to locate the real issue with the Sentry Spans.
# Resources
* branch-name: `feat-memory-leak`
# Ideas
I want to try different things:
* [x] Try the workers for longer. Maybe there is some problem that I can see at the end.
* [ ] Setup webhooks
* [ ] Try different benefits, like license key or OAuth With Github.
* [x] Try throing errors to workers and see if there is any problem on retries.